
Figure 9.6
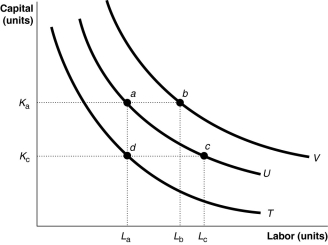
-Refer to Figure 9.6.The movement from isoquant T to isoquant U depicts
A) a change in preferences with regards to input usage.
B) an increase in the cost of production.
C) an increase in output.
D) an increase in labour usage holding capital and output constant.
Correct Answer:
Verified
Q139: Ford Motor Company started producing the Model
Q140: A Toyota plant president was quoted as
Q143: Figure 9.7 Q146: Suppose the price of capital and labour Q148: Suppose Argyle Sachs has to choose between Q241: The marginal rate of technical substitution is Q262: An isocost line shows Q267: What are economies of scale? What are Q269: Higher isocost lines correspond to higher Q278: What is the difference between total cost
![]()
A)
A)all the possible combinations
A)profits.
B)total costs
Unlock this Answer For Free Now!
View this answer and more for free by performing one of the following actions

Scan the QR code to install the App and get 2 free unlocks

Unlock quizzes for free by uploading documents