
Figure 9.7
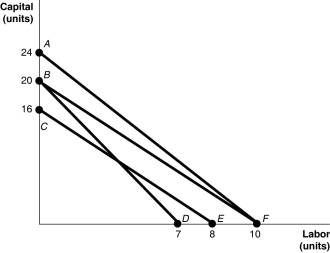
-Refer to Figure 9.7.The lines shown in the diagram are isocost lines.Which of the following shows an increase in the price of labour while the price of capital remains unchanged?
A) the movement from AF to BD
B) the movement from AF to CE
C) the movement from BF to BD
D) the movement from BF to CE
Correct Answer:
Verified
Q148: Suppose Argyle Sachs has to choose between
Q150: Figure 9.6 Q152: Figure 9.7 Q155: Due to a downturn in business and Q261: An important reason why diseconomies of scale Q266: If production displays constant returns to scale, Q269: Higher isocost lines correspond to higher Q271: You own a business that answers telephone Q275: If the long-run average total cost curve Q277: An isoquant shows
![]()
![]()
A)profits.
B)total costs
A)the combinations of two goods
Unlock this Answer For Free Now!
View this answer and more for free by performing one of the following actions

Scan the QR code to install the App and get 2 free unlocks

Unlock quizzes for free by uploading documents