Multiple Choice

Figure 10.4
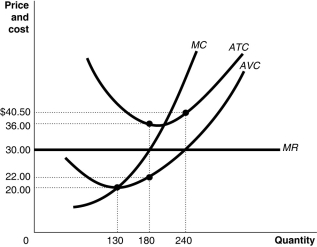
Figure 10.4 shows the cost and demand curves for a profit-maximizing firm in a perfectly competitive market.
-Refer to Figure 10.4.If the market price is $30, the firm's profit-maximizing output level is
A) 0.
B) 130.
C) 180.
D) 240.
Correct Answer:
Verified
Related Questions

