
Figure 10.4
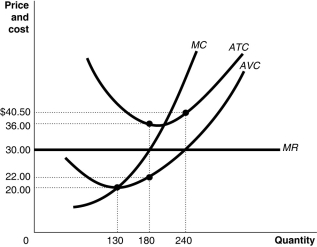
Figure 10.4 shows the cost and demand curves for a profit-maximizing firm in a perfectly competitive market.
-Refer to Figure 10.4.If the market price is $30 and if the firm is producing output, what is the amount of its total variable cost?
A) $7,200
B) $6,480
C) $5,400
D) $3,960
Correct Answer:
Verified
Q52: Assuming a market price of $4,
Q54: Figure 10.4 Q56: Figure 10.2 Q60: Figure 10.2 Q62: An increase in demand for Canadian farm Q73: For a perfectly competitive firm, which of Q83: A perfectly competitive firm's marginal revenue curve Q92: A firm's total profit can be calculated Q101: A perfectly competitive firm earns a profit Q149: A perfectly competitive firm breaks even at Unlock this Answer For Free Now! View this answer and more for free by performing one of the following actions Scan the QR code to install the App and get 2 free unlocks Unlock quizzes for free by uploading documents
![]()
![]()
![]()

