Multiple Choice

Figure 10.5
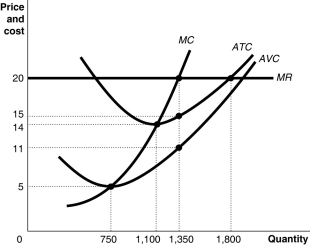
Figure 10.5 shows cost and demand curves facing a typical firm in a constant-cost, perfectly competitive industry.
-Refer to Figure 10.5.The firm's manager suggests that the firm's goal should be to maximize average profit.In that case, what is the output level and what is the average profit that will achieve the manager's goal?
A) Q = 1,350 units, average profit =$5
B) Q = 1,100 units, average profit =$6
C) Q = 1,350 units, average profit =$9
D) Q = 1,800 units, average profit =$20
Correct Answer:
Verified
Related Questions

