
Figure 10.5
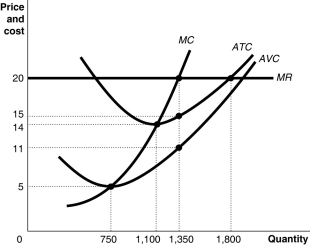
Figure 10.5 shows cost and demand curves facing a typical firm in a constant-cost, perfectly competitive industry.
-Refer to Figure 10.5.What is the amount of the firm's fixed cost of production?
A) $5,400
B) $6,750
C) $8,100
D) It cannot be determined.
Correct Answer:
Verified
Q60: Figure 10.2 Q62: An increase in demand for Canadian farm Q64: Suppose Veronica sells teapots in the Q65: Figure 10.5 Q83: A perfectly competitive firm's marginal revenue curve Q101: A perfectly competitive firm earns a profit Q103: All of the following can be used Q143: When a perfectly competitive firm finds that Q149: A perfectly competitive firm breaks even at Q152: A perfectly competitive firm's supply curve is
![]()
![]()
Unlock this Answer For Free Now!
View this answer and more for free by performing one of the following actions

Scan the QR code to install the App and get 2 free unlocks

Unlock quizzes for free by uploading documents