
Figure 10.10
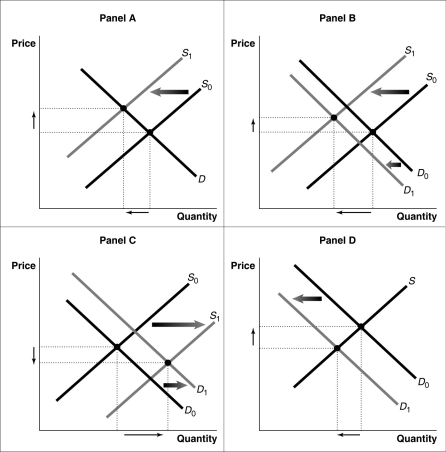
-Refer to Figure 10.10.Consider a typical firm in a perfectly competitive industry which is incurring short-run losses.Which of the diagrams in the figure shows the effect on the industry as it transitions to a long-run equilibrium?
A) Panel A
B) Panel B
C) Panel C
D) Panel D
Correct Answer:
Verified
Q110: Figure 10.7 Q113: Figure 10.8 Q116: Figure 10.9 Q184: If a firm's fixed cost exceeds its Q206: Under what conditions should a competitive firm Q210: If in a perfectly competitive industry, the Q212: If, in a perfectly competitive industry, the Q216: In long-run perfectly competitive equilibrium, which of Q217: If a typical firm in a perfectly Q219: If a typical firm in a perfectly Unlock this Answer For Free Now! View this answer and more for free by performing one of the following actions Scan the QR code to install the App and get 2 free unlocks Unlock quizzes for free by uploading documents
![]()
![]()
![]()

