
Figure 11.3
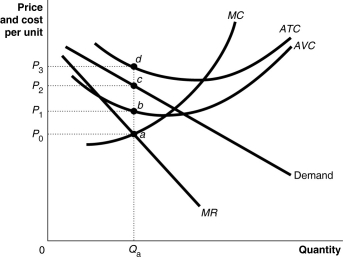
Figure 11.3 shows short-run cost and demand curves for a monopolistically competitive firm in the market for designer watches.
-Refer to Figure 11.3.If the firm represented in the diagram is currently producing and selling Qₐ units, what is the price charged?
A) P₀
B) P₁
C) P₂
D) P₃
Correct Answer:
Verified
Q24: Figure 11.3 Q25: Table 11-1 Q25: Table 11-1 Q28: Q45: When a monopolistically competitive firm cuts its Q54: Explain the differences between total revenue, average Q62: A monopolistically competitive firm maximizes profit where Q63: What is the profit-maximizing rule for a Q67: Table 11-2 Q71: Unlike a perfectly competitive firm, for a Unlock this Answer For Free Now! View this answer and more for free by performing one of the following actions Scan the QR code to install the App and get 2 free unlocks Unlock quizzes for free by uploading documents
![]()
![]()
A)price

