Multiple Choice

Figure 11.3
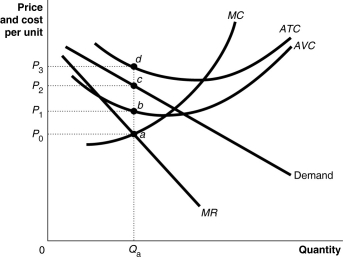
Figure 11.3 shows short-run cost and demand curves for a monopolistically competitive firm in the market for designer watches.
-Refer to Figure 11.3.What is the area that represents the loss made by the firm?
A) the area P₀adP₃
B) the area P₁bcP₂
C) the area P₀acP₂
D) the area P₂cdP₃
Correct Answer:
Verified
Related Questions
Q46: Figure 11-3 Q56: Figure 11.3 Q57: Unique to New Brunswick, Beausoleil oysters Q61: Table 11-3 Q65: If price exceeds average variable cost but![]()
![]()

