Multiple Choice
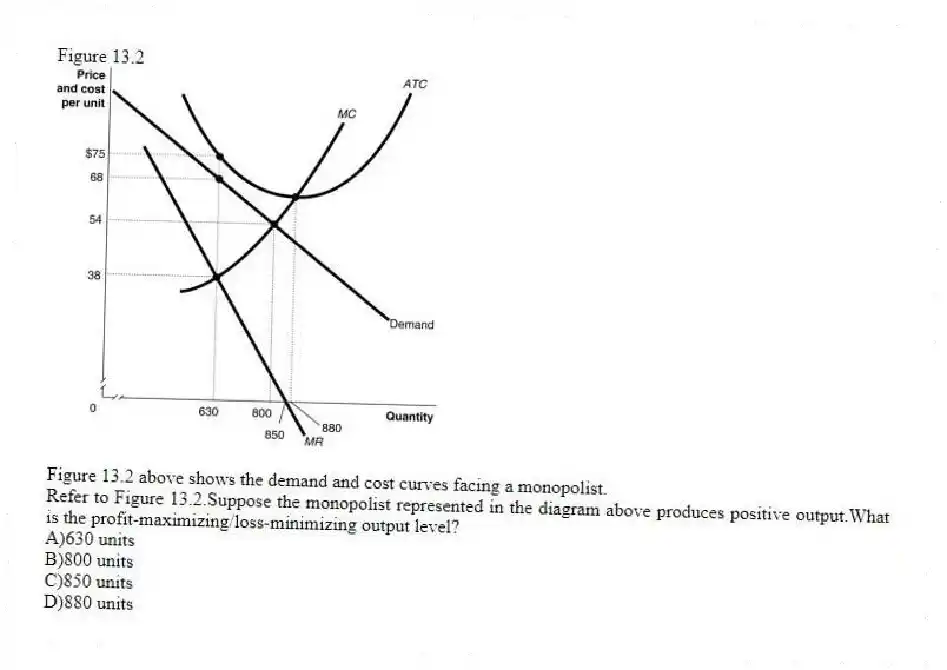
Figure 13.2
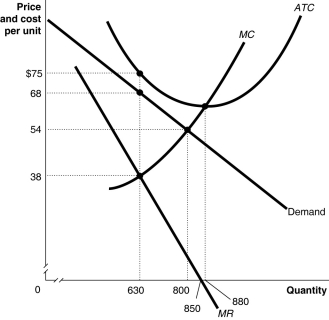
Figure 13.2 above shows the demand and cost curves facing a monopolist.
-Refer to Figure 13.2.Suppose the monopolist represented in the diagram above produces positive output.What is the profit-maximizing/loss-minimizing output level?
A) 630 units
B) 800 units
C) 850 units
D) 880 units
Correct Answer:
Verified
Related Questions

