Multiple Choice
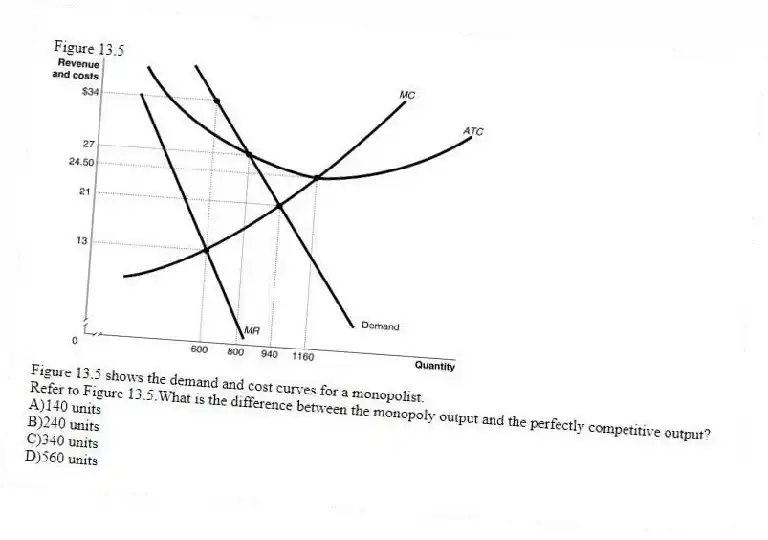
Figure 13.5
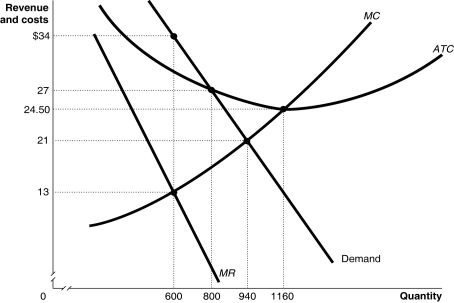
Figure 13.5 shows the demand and cost curves for a monopolist.
-Refer to Figure 13.5.What is the difference between the monopoly output and the perfectly competitive output?
A) 140 units
B) 240 units
C) 340 units
D) 560 units
Correct Answer:
Verified
Related Questions

