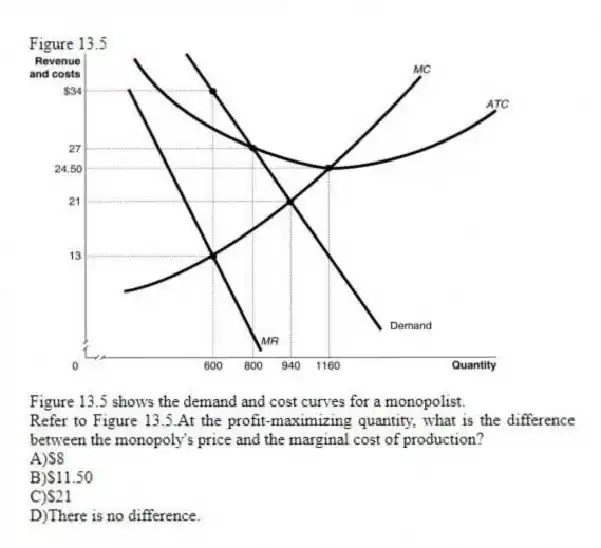
Figure 13.5
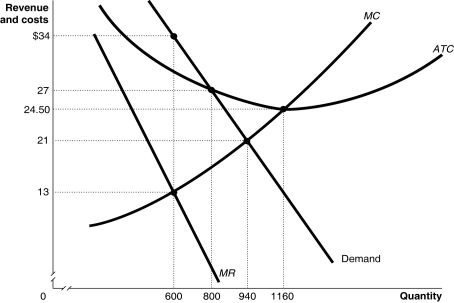
Figure 13.5 shows the demand and cost curves for a monopolist.
-Refer to Figure 13.5.At the profit-maximizing quantity, what is the difference between the monopoly's price and the marginal cost of production?
A) $8
B) $11.50
C) $21
D) There is no difference.
Correct Answer:
Verified
Q79: Figure 13.3 Q84: Figure 13.6 Q87: Figure 13.4 Q102: Long-run economic profits would most likely exist Q110: Which of the following statements applies to Q123: In the short run, even if a Q145: Compared to perfect competition, the consumer surplus Q158: Why does a monopoly cause a deadweight Q159: A profit-maximizing monopoly's price is Q160: What happens to a monopoly's revenue when Unlock this Answer For Free Now! View this answer and more for free by performing one of the following actions Scan the QR code to install the App and get 2 free unlocks Unlock quizzes for free by uploading documents
![]()
![]()
![]()
A)the same as

