
Figure 14.2
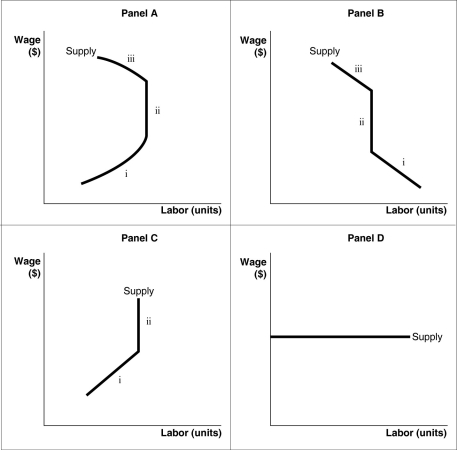
-Refer to Figure 14.2.Which of the panels in the diagram best represents an individual's labour supply curve?
A) Panel A
B) Panel B
C) Panel C
D) Panel D
Correct Answer:
Verified
Q47: Table 14.3 Q57: Which of the following best explains why Q74: Technological advancements that increase labour's productivity shift Q80: What are the five most important variables Q81: The income effect of a wage increase Q84: If Alan Shaw reduces his work hours Q86: An individual's labour supply curve shows Q93: The combined effect (both income and substitution) Q96: How will an increase in population affect Q98: The labour supply for an industry would
A) the
Unlock this Answer For Free Now!
View this answer and more for free by performing one of the following actions

Scan the QR code to install the App and get 2 free unlocks

Unlock quizzes for free by uploading documents