
Figure 15.6
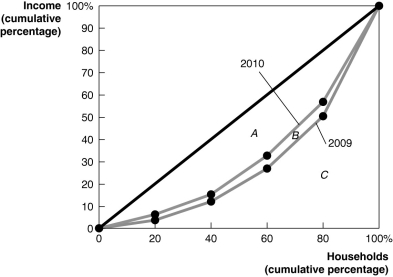
-Refer to Figure 15.6 to answer the following questions.
a.Did the distribution of income become more equal in 2010 that it was in 2009, or did it become less equal? Explain.
b.If area A = 1,600, area B = 200, and area C = 3,200, calculate the Gini coefficient for 2009 and the Gini coefficient for 2010.
Correct Answer:
Verified
View Answer
Unlock this answer now
Get Access to more Verified Answers free of charge
Q116: Holding all other factors constant, income earned
Q120: Figure 15.5 Q121: Figure 15.5 Q122: Table 15.6 Q127: Absolute poverty is Q128: Compare the distribution of income in Canada Q199: If the government wants to minimize the Q205: The Gini coefficient is measured by Q224: Which of the following tax systems would Q258: Describe the main factors economists believe cause Unlock this Answer For Free Now! View this answer and more for free by performing one of the following actions Scan the QR code to install the App and get 2 free unlocks Unlock quizzes for free by uploading documents
![]()
![]()
A)not being able to afford
A)summing up

