Multiple Choice
Figure 4-6
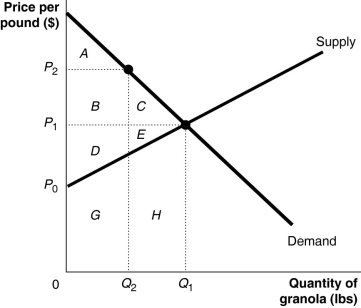 Figure 4-6 shows the market for granola. The market is initially in equilibrium at a price of P₁ and a quantity of Q₁. Now suppose producers decide to cut output to Q₂ in order to raise the price to P₂.
-Refer to Figure 4-6.At the price P₂,consumers are willing to buy the Q₂ pounds of granola.Is this an economically efficient quantity?
A) No, the marginal benefit of the last unit (Q₂) exceeds the marginal cost of that last unit.
B) Yes, otherwise consumers would not buy Q₂ units.
C) Yes, because the price P₂ shows what consumers are willing to pay for the product.
D) No, the marginal cost of the last unit (Q₂) exceeds the marginal benefit of the last unit.
Correct Answer:
Verified
Related Questions

