
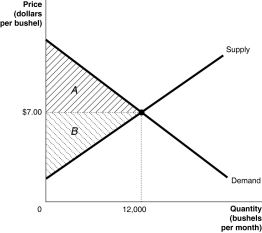
The graph below represents the market for alfalfa.The market price is $7.00 per bushel.Identify the areas representing consumer surplus,producer surplus,and economic surplus.
Correct Answer:
Verified
View Answer
Unlock this answer now
Get Access to more Verified Answers free of charge
Q110: What is meant by the term "economic
Q120: What is deadweight loss? When is deadweight
Q201: Table 4-7 Q207: Table 4-7 Q208: Table 4-7 Q208: Table 4-7 Q210: The graph below represents the market for Q217: The graph below represents the market for Q219: Table 4-7 Q220: Table 4-7 Unlock this Answer For Free Now! View this answer and more for free by performing one of the following actions Scan the QR code to install the App and get 2 free unlocks Unlock quizzes for free by uploading documents
![]()
![]()
![]()
![]()
![]()
![]()

