Multiple Choice
Figure 4-9 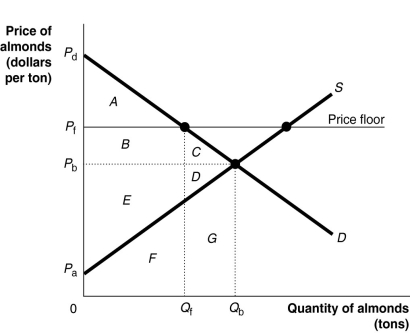 Figure 4-9 shows the demand and supply curves for the almond market. The government believes that the equilibrium price is too low and tries to help almond growers by setting a price floor at Pf.
-Refer to Figure 4-9. What area represents consumer surplus after the imposition of the price floor?
A) A + B + E
B) A + B
C) A + B + E + F
D) A
Correct Answer:
Verified
Related Questions

