Figure 7-2
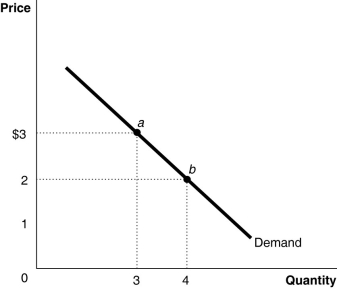 Figure 7-2 represents the demand for ice cream cones.
-Refer to Figure 7-2.When the price of ice cream cones increases from $2 to $3,quantity demanded decreases from 4 ice cream cones to 3 ice cream cones.This change in quantity demanded is due to
A) the price and output effects.
B) the income and substitution effects.
C) the law of diminishing marginal utility.
D) the fact that marginal willingness to pay falls.
Correct Answer:
Verified
Q125: The demand curve for a luxury good
Q127: Each price-quantity combination on a consumer's demand
Q128: The only Giffen goods that have been
Q133: The demand curve for a Giffen good
Q135: A Giffen good could be either a
Q138: For a demand curve to be upward
Q139: The income effect results in consumers increasing
Q140: Goods with upward sloping demand curves are
Q142: Consider a good whose consumption takes place
Q149: Identify the one statement that does not
Unlock this Answer For Free Now!
View this answer and more for free by performing one of the following actions

Scan the QR code to install the App and get 2 free unlocks

Unlock quizzes for free by uploading documents