
Figure 8-7
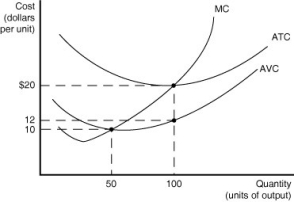
Figure 8-7 shows the cost structure for a firm.
-Refer to Figure 8-7.When the output level is 100 units average fixed cost is
A) $10.
B) $8.
C) $5.
D) This cannot be determined from the diagram.
Correct Answer:
Verified
Q193: Figure 8-6 Q209: All of the following cost curves are Q211: Average total cost is equal to average Q212: If production displays economies of scale, the Q218: Figure 8-7 Q220: In a diagram showing the average total Q221: In the long run, Q223: The president of Toyota's Georgetown plant was Q226: Figure 8-10 Q235: At the minimum efficient scale Unlock this Answer For Free Now! View this answer and more for free by performing one of the following actions Scan the QR code to install the App and get 2 free unlocks Unlock quizzes for free by uploading documents
![]()
![]()
A)the firm's fixed costs
![]()
A)all possible economies

