
Figure 8-7
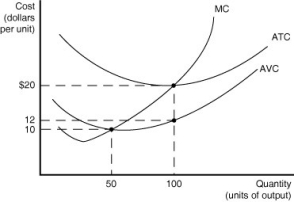
Figure 8-7 shows the cost structure for a firm.
-Refer to Figure 8-7.When output level is 100,what is the total cost of production?
A) $20
B) $1,000
C) $1,200
D) $2,000
Correct Answer:
Verified
Q193: Figure 8-6 Q202: Suppose the total cost of producing 40,000 Q205: Explain how the listed events (a-d)would affect Q207: As output increases, average fixed cost gets Q209: All of the following cost curves are Q210: As output increases, the distance between average Q213: Which of the following is true at Q218: As the level of output increases, what Q218: Figure 8-7 Q220: In a diagram showing the average total
![]()
![]()
Unlock this Answer For Free Now!
View this answer and more for free by performing one of the following actions

Scan the QR code to install the App and get 2 free unlocks

Unlock quizzes for free by uploading documents