Figure 8-11
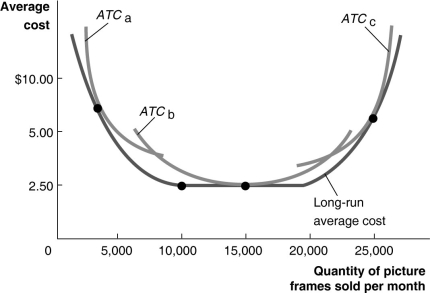 Figure 8-11 illustrates the long-run average cost curve for a firm that produces picture frames. The graph also includes short-run average cost curves for three firm sizes: ATCₐ, ATCb and ATCc.
-Refer to Figure 8-11.The minimum efficient scale of output is reached at what rate of output?
A) 10,000 workers
B) 5,000 picture frames
C) 20,000 picture frames
D) 10,000 picture frames
Correct Answer:
Verified
Q242: Figure 8-11 Q242: Diseconomies of scale occur when Q243: Figure 8-11 Q246: Table 8-8 Q246: Two stores-Lazy Guys and Ralph's Recliners-are located Q249: The River Rouge plant was built by Unlock this Answer For Free Now! View this answer and more for free by performing one of the following actions Scan the QR code to install the App and get 2 free unlocks Unlock quizzes for free by uploading documents
![]()
A)long-run average costs
![]()

