Multiple Choice
Figure 8-11
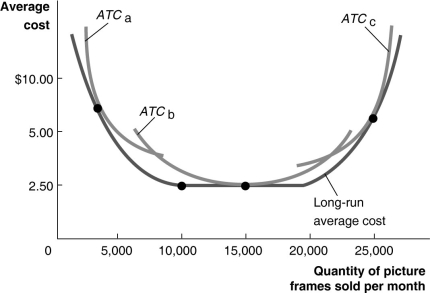 Figure 8-11 illustrates the long-run average cost curve for a firm that produces picture frames. The graph also includes short-run average cost curves for three firm sizes: ATCₐ, ATCb and ATCc.
-Refer to Figure 8-11.For output rates greater than 20,000 picture frames per month
A) the firm will not make a profit because the average cost of production will be too high.
B) the firm will experience diseconomies of scale.
C) the firm will experience diminishing returns.
D) the short-run average total cost will equal the long-run average total cost of production.
Correct Answer:
Verified
Related Questions
Q223: The president of Toyota's Georgetown plant was
Q230: The president of Toyota's Georgetown plant was
Q236: Over the past twenty years, the number

