Multiple Choice
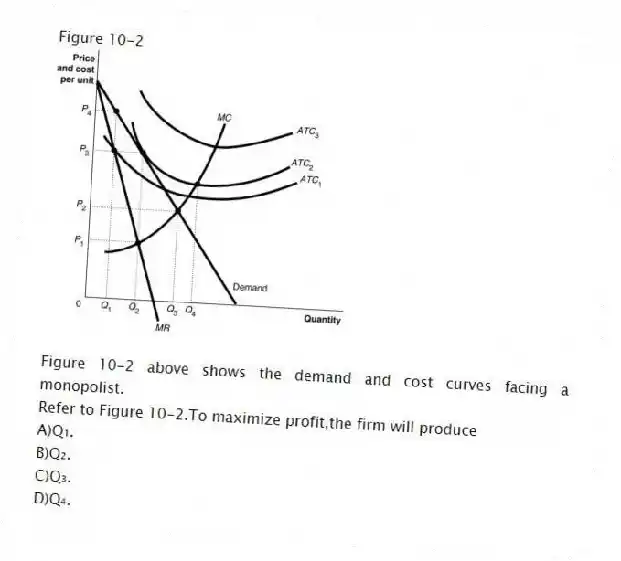
Figure 10-2
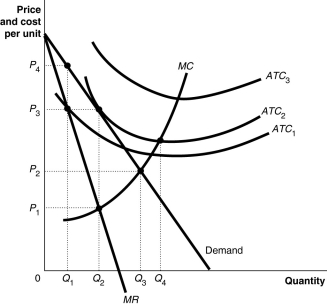
Figure 10-2 above shows the demand and cost curves facing a monopolist.
-Refer to Figure 10-2.To maximize profit,the firm will produce
A) Q₁.
B) Q₂.
C) Q₃.
D) Q₄.
Correct Answer:
Verified
Related Questions
Q81: U.S.antitrust laws are designed to prohibit monopolization
Q83: Microsoft hires marketing and sales specialists to
Q88: If a monopolist's price is $50 per
Q89: Because a monopoly's demand curve is the
Q93: Figure 10-2 Q93: A public franchise gives the exclusive right
![]()
Unlock this Answer For Free Now!
View this answer and more for free by performing one of the following actions

Scan the QR code to install the App and get 2 free unlocks

Unlock quizzes for free by uploading documents