Multiple Choice
Figure 15-4
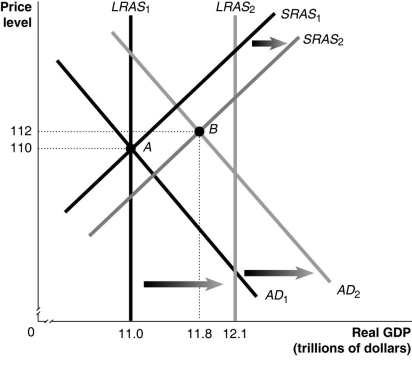
-Refer to Figure 15-4.Given the economy is at point A in year 1,what is the inflation rate between year 1 and year 2?
A) 0.9%
B) 1.8%
C) 2.7%
D) 3.0%
Correct Answer:
Verified
Related Questions
Q207: Explain how the economy moves back to
Q232: When people became less concerned with the
Q235: Which of the following is one reason
Unlock this Answer For Free Now!
View this answer and more for free by performing one of the following actions

Scan the QR code to install the App and get 2 free unlocks

Unlock quizzes for free by uploading documents