Figure 17-2
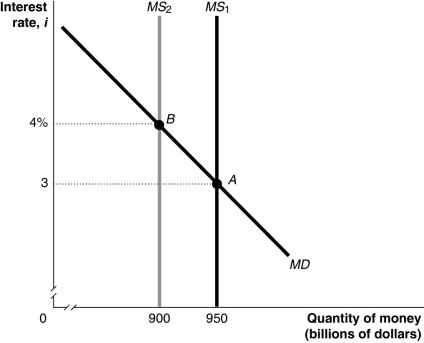
-Refer to Figure 17-2.In the figure above,the movement from point A to point B in the money market would be caused by
A) an increase in the price level.
B) a decrease in real GDP.
C) an open market sale of Treasury securities by the Federal Reserve.
D) a decrease in the required reserve ratio by the Federal Reserve.
Correct Answer:
Verified
Q41: A monetary policy target is a variable
Q45: The monetary policy target the Federal Reserve
Q46: The money demand curve,with the interest rate
Q48: The money demand curve has a negative
Q50: When the price of a financial asset
Q51: An increase in real GDP
A)increases the buying
Q55: Figure 17-4 Q55: The money supply curve is vertical if Q57: Figure 17-3 Q60: The interest rate that banks charge other
![]()
A)banks
![]()
Unlock this Answer For Free Now!
View this answer and more for free by performing one of the following actions

Scan the QR code to install the App and get 2 free unlocks

Unlock quizzes for free by uploading documents