Multiple Choice

Figure 18-3
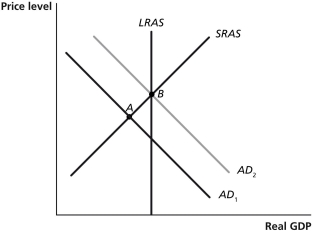
-Refer to Figure 18-3.In the graph above,suppose the economy is initially at point A.The movement of the economy to point B as shown in the graph illustrates the effect of which of the following policy actions by the Congress and the president?
A) a decrease in income taxes
B) a decrease in interest rates
C) a decrease in government purchases
D) an increase in the money supply
Correct Answer:
Verified
Related Questions
Q56: Figure 18-1 Q58: Prior to the 1930s,the majority of dollars Unlock this Answer For Free Now! View this answer and more for free by performing one of the following actions Scan the QR code to install the App and get 2 free unlocks Unlock quizzes for free by uploading documents
![]()

