
Figure 18-4
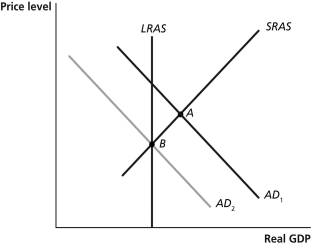
-Refer to Figure 18-4.In the graph above,suppose the economy is initially at point A.The movement of the economy to point B as shown in the graph illustrates the effect of which of the following policy actions by the Congress and the president?
A) an increase in transfer payments
B) an increase in interest rates
C) an increase in the marginal income tax rate
D) an open market purchase of Treasury bills
Correct Answer:
Verified
Q65: Expansionary fiscal policy involves increasing government purchases
Q66: Contractionary fiscal policy to prevent real GDP
Q69: If the economy is growing beyond potential
Q75: Figure 18-2 Q78: Contractionary fiscal policy is used to decrease Q81: Consider the following statement,"The Federal Reserve fights Q85: Figure 18-5 Q88: From an initial long-run equilibrium,if aggregate demand Q98: Figure 18-6 Q100: Figure 18-5 Unlock this Answer For Free Now! View this answer and more for free by performing one of the following actions Scan the QR code to install the App and get 2 free unlocks Unlock quizzes for free by uploading documents
![]()
![]()
![]()
![]()

