
Use the figure for the question(s) below.
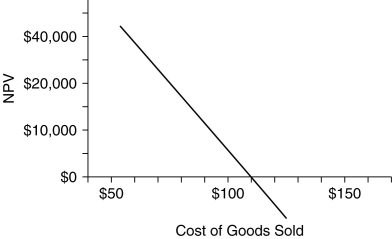
-The graph above shows the break-even analysis for the cost of making a certain good.Based on this chart,which of the following is true?
A) The net present value (NPV) of the project increases with increased cost of goods sold.
B) The project should not be undertaken if the predicted cost of goods sold is less than $110.
C) The net present value (NPV) of the project will be positive if the cost of good sold is greater than $110.
D) If the good costs $110 to make, the net present value (NPV) of the project will be zero.
E) The cost of goods sold should not be a factor in deciding whether to undertake the project.
Correct Answer:
Verified
Q68: What are the most difficult parts of
Q71: What is the most important function of
Q82: The EBIT break even point can be
Q85: The manufacturer of a brand of kitchen
Q86: Use the figure for the question(s)below.
Q89: The difference between scenario analysis and sensitivity
Q91: Use the table for the question(s)below.
Q92: Use the table for the question(s)below.
Q98: A maker of computer games expects to
Q100: A maker of kitchenware is planning on
Unlock this Answer For Free Now!
View this answer and more for free by performing one of the following actions

Scan the QR code to install the App and get 2 free unlocks

Unlock quizzes for free by uploading documents