
Use the following pair of graphs,which illustrate the market for corn (which is used to produce corn-based ethanol)and a representative firm,to answer the following questions.
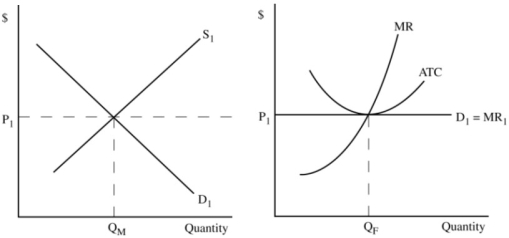
Figure 7.1
a.Assume policymakers pass a law requiring that all gas sold in the United States contain at least 10 percent corn-based ethanol.In the graphs above,illustrate the short-run effects of this law.In particular,show how the law would affect
• the short-run equilibrium in the market for corn,
• the short-run demand curve faced by the representative firm,and
• the representative firm's short-run profit-maximizing level of output.
Label the new curves and equilibrium values using a subscript 2.
b.Next,graphically illustrate how,after the initial changes you illustrated in question 7,the corn market and the representative firm would adjust back to long-run equilibrium.Label any new curves and equilibrium values using a subscript 3.After all adjustments have taken place,what has happened to the equilibrium market price,the number of firms operating in the market,and the representative firm's profits? Why?
Correct Answer:
Verified
View Answer
Unlock this answer now
Get Access to more Verified Answers free of charge
Q96: Explain why a firm maximizes its profits
Q97: Assume the firms in a perfectly competitive
Q98: Summarize the characteristics of a perfectly competitive
Q99: Assume there is a decrease in the
Q100: Because of the large number of firms
Q101: Explain why,when all adjustment have taken place,the
Q102: Assume the production technology changes for a
Q103: Fill in the blanks to complete the
Q104: Assume a perfectly competitive firm is currently
Q106: Assume the government decides to impose a
Unlock this Answer For Free Now!
View this answer and more for free by performing one of the following actions

Scan the QR code to install the App and get 2 free unlocks

Unlock quizzes for free by uploading documents