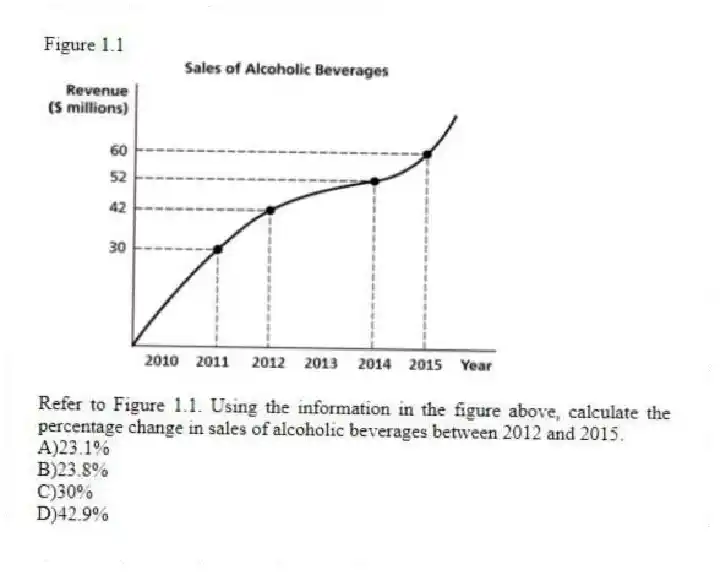
Figure 1.1
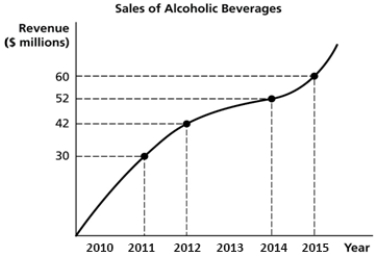
-Refer to Figure 1.1. Using the information in the figure above, calculate the percentage change in sales of alcoholic beverages between 2012 and 2015.
A) 23.1%
B) 23.8%
C) 30%
D) 42.9%
Correct Answer:
Verified
Q144: _ have a horizontal and a vertical
Q146: Figure 1.1 Q147: If a straight line passes through the Q148: Which of the following are primarily macroeconomic Q151: Suppose when the price of tablets falls, Q154: Suppose that to increase sales of hybrid Q212: If a straight line passes through the Q225: Which of the following statements is false? Q227: Figure 1-4 Q238: Figure 1-2 Unlock this Answer For Free Now! View this answer and more for free by performing one of the following actions Scan the QR code to install the App and get 2 free unlocks Unlock quizzes for free by uploading documents
![]()
A)An
![]()
![]()

