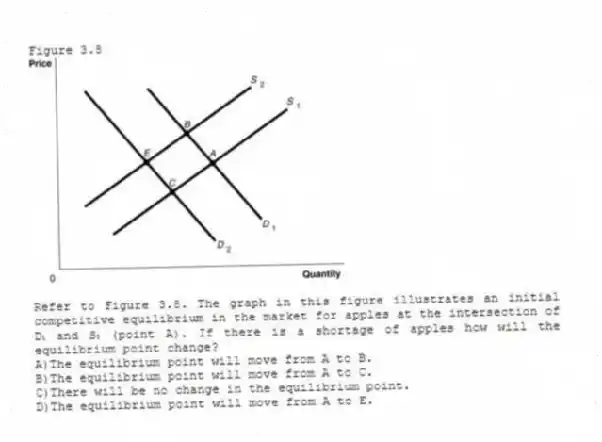
Figure 3.8
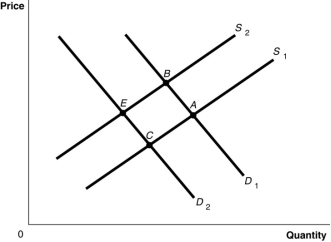
-Refer to Figure 3.8. The graph in this figure illustrates an initial competitive equilibrium in the market for apples at the intersection of D₁ and S₁ (point A) . If there is a shortage of apples how will the equilibrium point change?
A) The equilibrium point will move from A to B.
B) The equilibrium point will move from A to C.
C) There will be no change in the equilibrium point.
D) The equilibrium point will move from A to E.
Correct Answer:
Verified
Q168: Assume that both the demand curve and
Q169: Figure 3.8 Q170: Assume that the demand curve for tablet Q171: A decrease in the equilibrium price for Q172: Figure 3.8 Q174: Figure 3.8 Q175: A decrease in the equilibrium quantity for Q176: If a positive change in technology caused Q177: Figure 3.8 Q178: Figure 3.8 Unlock this Answer For Free Now! View this answer and more for free by performing one of the following actions Scan the QR code to install the App and get 2 free unlocks Unlock quizzes for free by uploading documents
![]()
![]()
![]()
![]()
![]()

