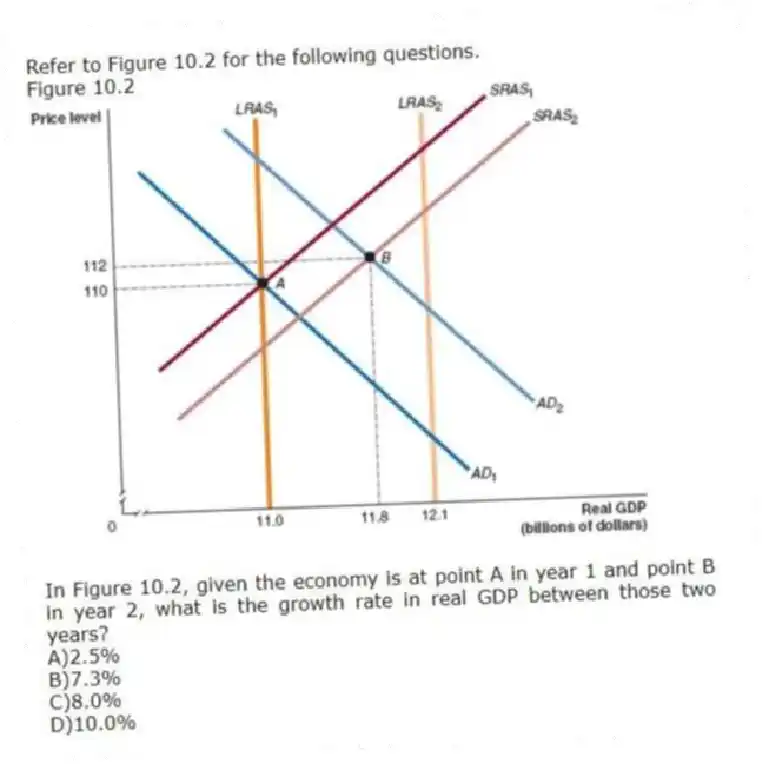
Refer to Figure 10.2 for the following questions.
Figure 10.2
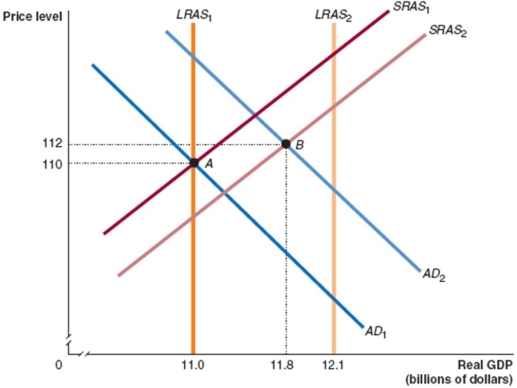
-In Figure 10.2, given the economy is at point A in year 1 and point B in year 2, what is the growth rate in real GDP between those two years?
A) 2.5%
B) 7.3%
C) 8.0%
D) 10.0%
Correct Answer:
Verified
Q78: Which of the following correctly describes the
Q79: Explain how each of the following events
Q80: Why does the short-run aggregate supply (SRAS)curve
Q81: Starting from long-run equilibrium, use the basic
Q84: Which of the following is an assumption
Q85: When the short-run aggregate supply curve and
Q86: Which of the following is considered a
Q87: Which of the following is true in
Q154: An adverse supply shock causes the short-run
Q240: What is a supply shock,and why might
Unlock this Answer For Free Now!
View this answer and more for free by performing one of the following actions

Scan the QR code to install the App and get 2 free unlocks

Unlock quizzes for free by uploading documents