
Assume that the economy is in the state described by the following table.
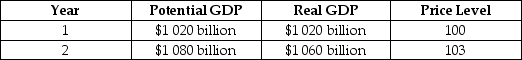
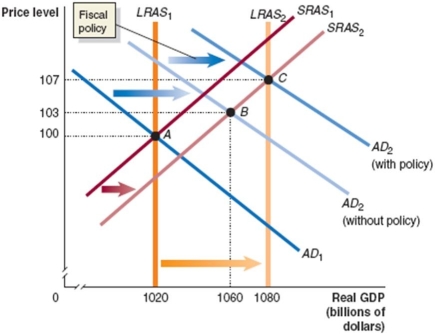
Draw a dynamic aggregate demand and aggregate supply diagram to illustrate the state of the economy in year 1 and year 2, assuming that no policy is pursued. Then illustrate the appropriate fiscal policy to use in this situation. Assume that the policy results in the economy producing at potential GDP. Provide an explanation.
_____________________________________________________________________________________________
_____________________________________________________________________________________________
Correct Answer:
Verified
View Answer
Unlock this answer now
Get Access to more Verified Answers free of charge
Q55: Suppose the economy is in the state
Q56: Identify each of the following as (i)part
Q57: Tax increases on business income slow down
Q58: If the equilibrium real GDP were higher
Q59: 'Contractionary fiscal policy' aims to reduce the
Q62: The government purchases multiplier is defined as:
A)
Q63: Suppose real GDP is $13 trillion, potential
Q64: If the government purchases multiplier equals 2,
Q157: The tax multiplier is calculated as "one
Q178: In the case of an upward-sloping aggregate
Unlock this Answer For Free Now!
View this answer and more for free by performing one of the following actions

Scan the QR code to install the App and get 2 free unlocks

Unlock quizzes for free by uploading documents