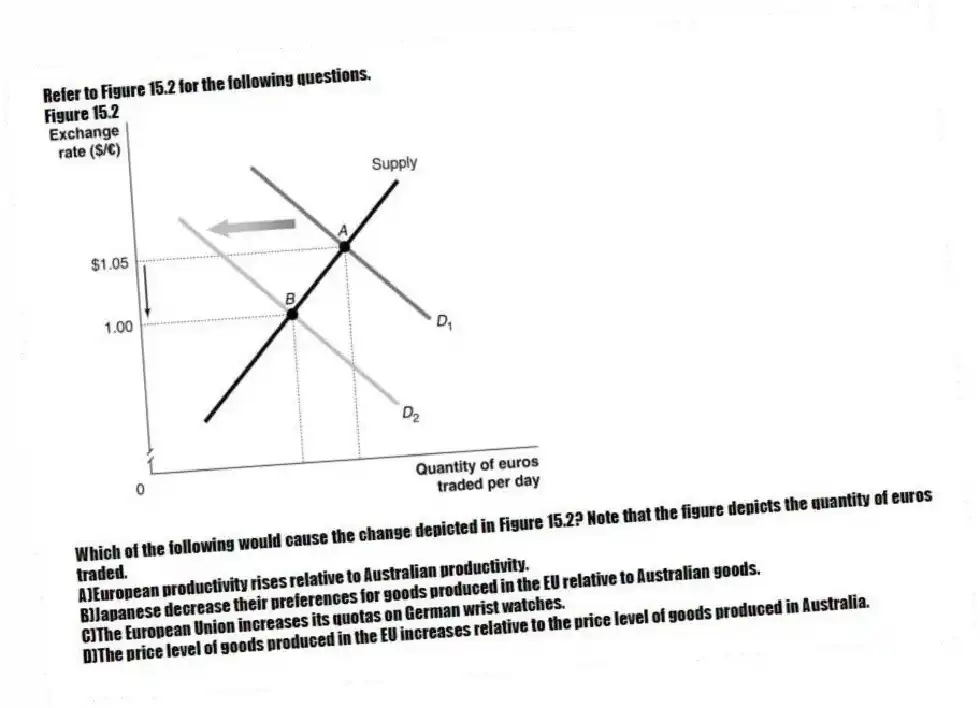
Refer to Figure 15.2 for the following questions.
Figure 15.2
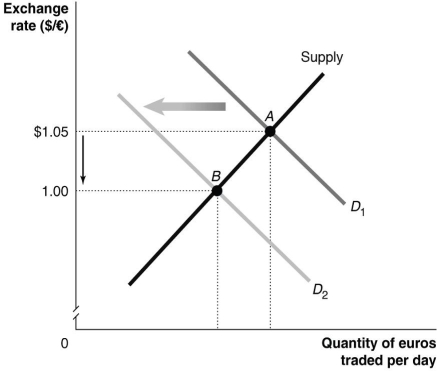
-Which of the following would cause the change depicted in Figure 15.2? Note that the figure depicts the quantity of euros traded.
A) European productivity rises relative to Australian productivity.
B) Japanese decrease their preferences for goods produced in the EU relative to Australian goods.
C) The European Union increases its quotas on German wrist watches.
D) The price level of goods produced in the EU increases relative to the price level of goods produced in Australia.
Correct Answer:
Verified
Q69: What factors are most important for determining
Q70: Because of the emissions testing scandal at
Q71: If there is _ in prices overseas
Q72: Suppose that average productivity of Chinese firms
Q73: Australians demand Japanese yen to:
A)enable them to
Q75: If one United States dollar could be
Q76: Which of the following would increase the
Q77: If the average rate of productivity growth
Q78: If prices rise slower in the United
Q79: How will the exchange rate (foreign currency
Unlock this Answer For Free Now!
View this answer and more for free by performing one of the following actions

Scan the QR code to install the App and get 2 free unlocks

Unlock quizzes for free by uploading documents