Multiple Choice
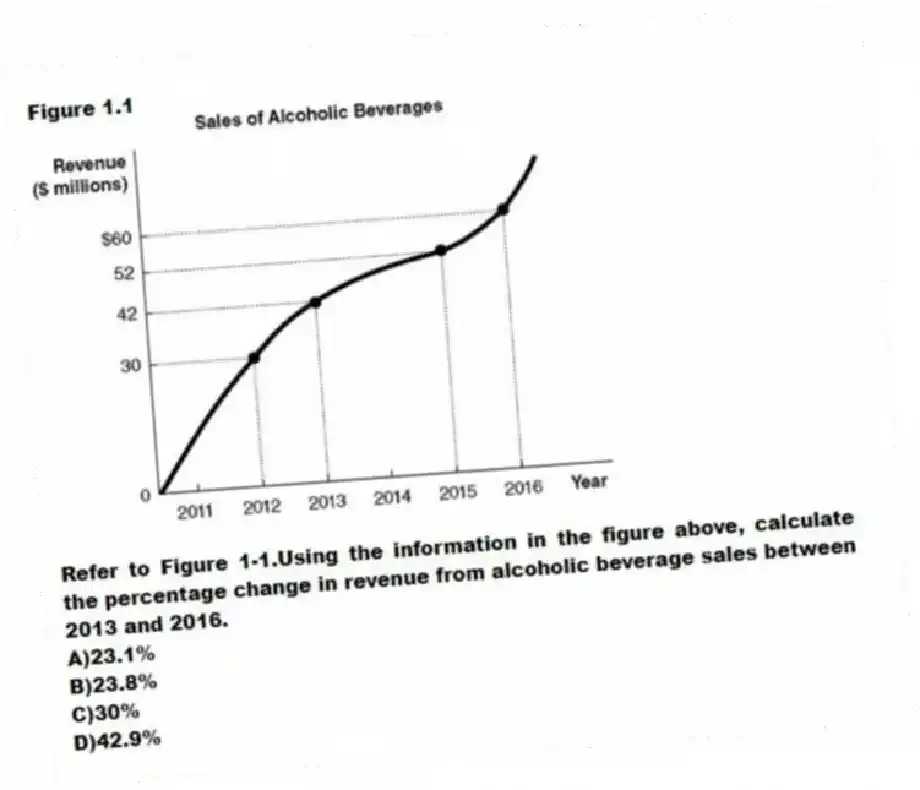
Figure 1.1
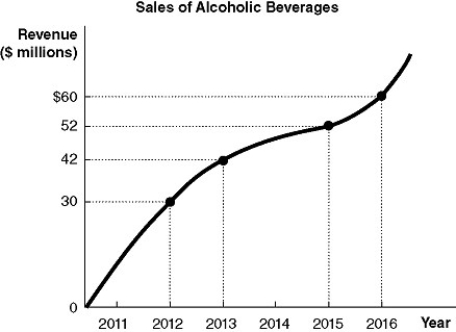
-Refer to Figure 1-1.Using the information in the figure above, calculate the percentage change in revenue from alcoholic beverage sales between 2013 and 2016.
A) 23.1%
B) 23.8%
C) 30%
D) 42.9%
Correct Answer:
Verified
Related Questions
Q216: In economics, an organization that produces a
Q217: What is the difference between goods and
Q218: In economics, all of the following is
Q219: A firm's technology may depend on which
Q220: What is the difference between an invention
Unlock this Answer For Free Now!
View this answer and more for free by performing one of the following actions

Scan the QR code to install the App and get 2 free unlocks

Unlock quizzes for free by uploading documents