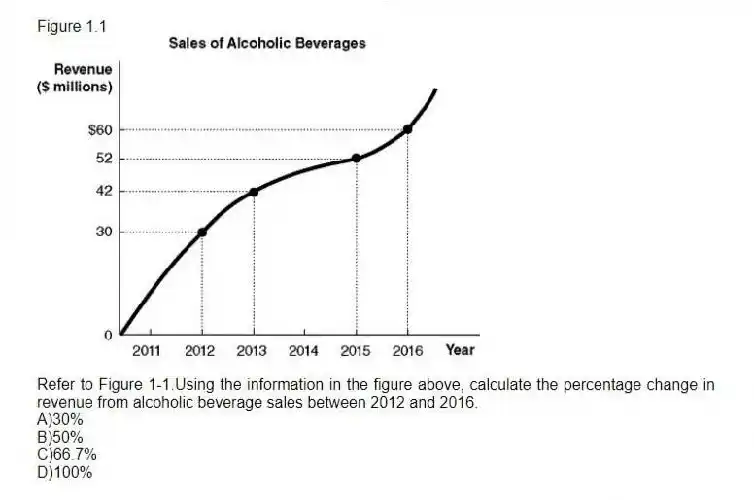
Figure 1.1
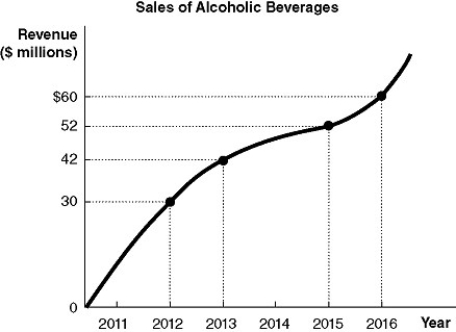
-Refer to Figure 1-1.Using the information in the figure above, calculate the percentage change in revenue from alcoholic beverage sales between 2012 and 2016.
A) 30%
B) 50%
C) 66.7%
D) 100%
Correct Answer:
Verified
Q226: Suppose when the price of laptops fall,
Q227: Figure 1-4 Q228: Figure 1-3 Q229: What is the "omitted variable" problem in Q230: At a recent faculty meeting, Lorraine Waverly, Q232: If the price of gasoline was $3.25 Q233: At a recent company meeting, Ravi Batra, Q234: The relationship between consumer spending and disposable Q235: If the price of milk was $2.50 Q236: In 2017, Hooverville consumed 205,000 tons of
![]()
![]()
Unlock this Answer For Free Now!
View this answer and more for free by performing one of the following actions

Scan the QR code to install the App and get 2 free unlocks

Unlock quizzes for free by uploading documents