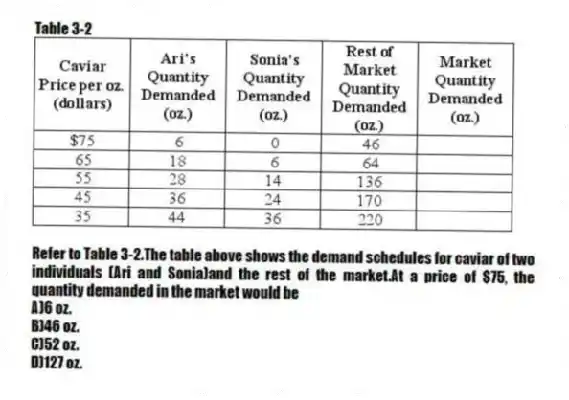
Table 3-2
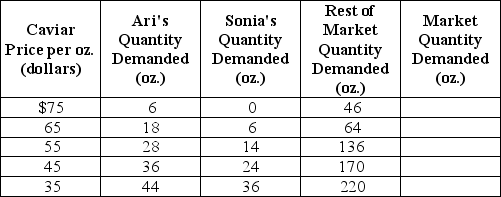
-Refer to Table 3-2.The table above shows the demand schedules for caviar of two individuals (Ari and Sonia) and the rest of the market.At a price of $75, the quantity demanded in the market would be
A) 6 oz.
B) 46 oz.
C) 52 oz.
D) 127 oz.
Correct Answer:
Verified
Q40: Figure 3-1 Q41: In June, buyers of titanium expect that Q42: In January, buyers of gold expect that Q43: A change in which variable will change Q44: Technological advancements have led to lower prices Q46: Factors that will tend to lead to Q47: For products like virtual reality headsets, _ Q48: Which of the following generation categories has Q49: The law of demand implies, holding everything Q50: Holding everything else constant, a decrease in
![]()
Unlock this Answer For Free Now!
View this answer and more for free by performing one of the following actions

Scan the QR code to install the App and get 2 free unlocks

Unlock quizzes for free by uploading documents