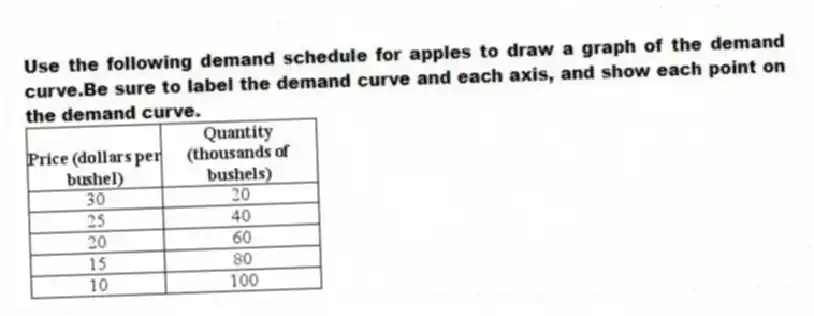
Use the following demand schedule for apples to draw a graph of the demand curve.Be sure to label the demand curve and each axis, and show each point on the demand curve.

Correct Answer:
Verified
Q77: A normal good is a good for
Q78: The income effect explains why there is
Q79: If consumers believe the price of iPads
Q80: What are the two effects that explain
Q81: A supply schedule
A)is a table that shows
Q83: If in the market for peaches the
Q84: In October 2005, the U.S.Fish and Wildlife
Q85: What is the difference between an "increase
Q86: Figure 3-2 Q87: Figure 3-2
![]()
![]()
Unlock this Answer For Free Now!
View this answer and more for free by performing one of the following actions

Scan the QR code to install the App and get 2 free unlocks

Unlock quizzes for free by uploading documents