Figure 3-8

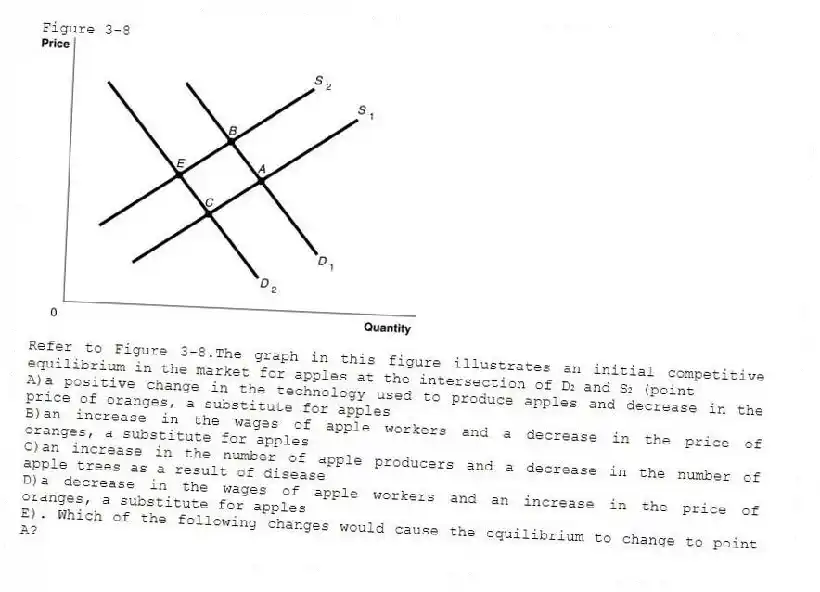
-Refer to Figure 3-8.The graph in this figure illustrates an initial competitive equilibrium in the market for apples at the intersection of D₂ and S₂ (point
A) a positive change in the technology used to produce apples and decrease in the price of oranges, a substitute for apples
B) an increase in the wages of apple workers and a decrease in the price of oranges, a substitute for apples
C) an increase in the number of apple producers and a decrease in the number of apple trees as a result of disease
D) a decrease in the wages of apple workers and an increase in the price of oranges, a substitute for apples
E) . Which of the following changes would cause the equilibrium to change to point A?
Correct Answer:
Verified
Q206: What would happen in the market for
Q207: The following appeared in a Florida newspaper
Q208: "Because chips and salsa are complements, an
Q209: Figure 3-8 Q210: Suppose the cost of growing organic corn Q212: Which of the following statements is true? Q213: Which of the following would definitely cause Q214: A decrease in the equilibrium quantity for Q215: If more insurance companies decide to cover Q216: Select the phrase that correctly completes the
![]()
A)An
Unlock this Answer For Free Now!
View this answer and more for free by performing one of the following actions

Scan the QR code to install the App and get 2 free unlocks

Unlock quizzes for free by uploading documents