Figure 3-8

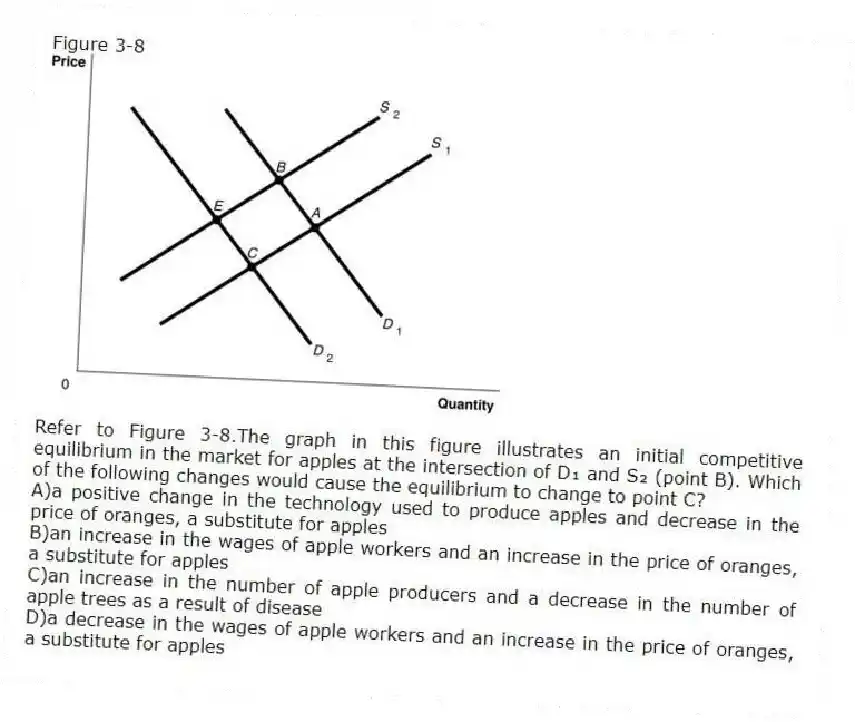
-Refer to Figure 3-8.The graph in this figure illustrates an initial competitive equilibrium in the market for apples at the intersection of D₁ and S₂ (point B) . Which of the following changes would cause the equilibrium to change to point C?
A) a positive change in the technology used to produce apples and decrease in the price of oranges, a substitute for apples
B) an increase in the wages of apple workers and an increase in the price of oranges, a substitute for apples
C) an increase in the number of apple producers and a decrease in the number of apple trees as a result of disease
D) a decrease in the wages of apple workers and an increase in the price of oranges, a substitute for apples
Correct Answer:
Verified
Q213: Which of the following would definitely cause
Q214: A decrease in the equilibrium quantity for
Q215: If more insurance companies decide to cover
Q216: Select the phrase that correctly completes the
Q217: A decrease in the equilibrium price for
Q219: Which of the following would cause a
Q220: Suppose that McDonald's successfully implements self-serve kiosks
Q221: Suppose a negative technological change in the
Q222: If the demand for a product increases
Q223: In 1984, the National Minimum Drinking Age
Unlock this Answer For Free Now!
View this answer and more for free by performing one of the following actions

Scan the QR code to install the App and get 2 free unlocks

Unlock quizzes for free by uploading documents