
Table 4-4
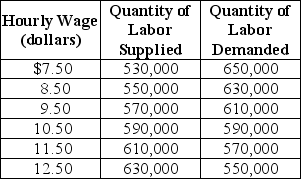
Table 4-4 shows the demand and supply schedules for the labor market in the city of Pixley.
-Refer to Table 4-4.Suppose that the quantity of labor supplied increases by 40,000 at each wage level.What are the new free market equilibrium hourly wage and the new equilibrium quantity of labor?
A) W = $8.50; Q = 550,000
B) W = $12.50; Q = 630,000
C) W = $9.50; Q = 610,000
D) W = $11.50; Q = 610,000
Correct Answer:
Verified
Q111: Table 4-4 Q112: Table 4-4 Q113: Figure 4-5 Q114: Table 4-4 Q115: The graph below represents the market for Q117: Table 4-4 Q118: Table 4-4 Q119: Which of the following is not a Q120: To affect the market outcome, a price Q121: Figure 4-6 Unlock this Answer For Free Now! View this answer and more for free by performing one of the following actions Scan the QR code to install the App and get 2 free unlocks Unlock quizzes for free by uploading documents
![]()
![]()
![]()
![]()
![]()
![]()
![]()

