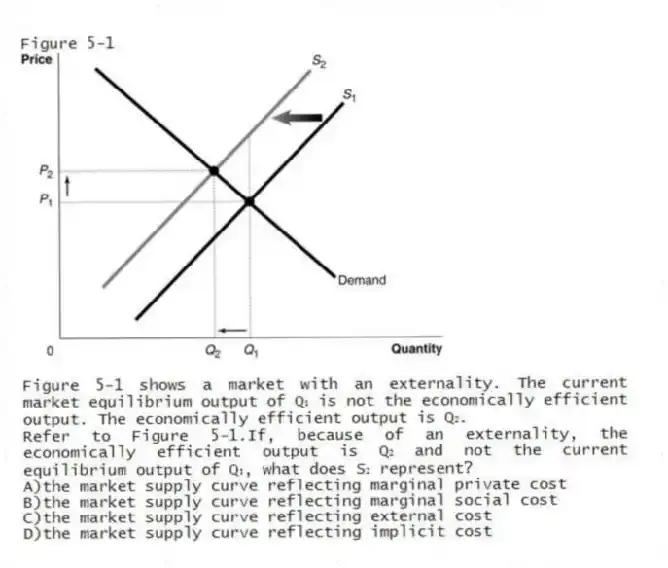
Figure 5-1
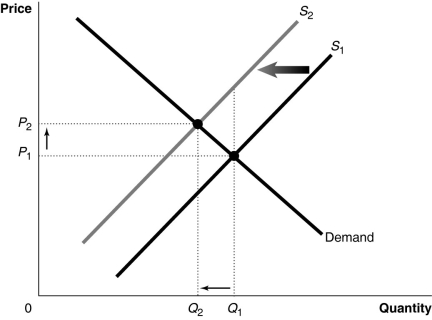
Figure 5-1 shows a market with an externality. The current market equilibrium output of Q₁ is not the economically efficient output. The economically efficient output is Q₂.
-Refer to Figure 5-1.If, because of an externality, the economically efficient output is Q₂ and not the current equilibrium output of Q₁, what does S₂ represent?
A) the market supply curve reflecting marginal private cost
B) the market supply curve reflecting marginal social cost
C) the market supply curve reflecting external cost
D) the market supply curve reflecting implicit cost
Correct Answer:
Verified
Q4: Figure 5-1 Q5: A negative externality exists if Q6: Which of the following is an example Q7: An externality is Q8: A positive externality causes Q10: If you burn your trash in the Q11: Which of the following activities create a Q12: Private costs Q13: When the federal government orders firms to Q14: Figure 5-1
![]()
A)there are price
A)a benefit realized by the
A)the marginal social benefit
A)are borne by producers of a
![]()
Unlock this Answer For Free Now!
View this answer and more for free by performing one of the following actions

Scan the QR code to install the App and get 2 free unlocks

Unlock quizzes for free by uploading documents