
Figure 5-2
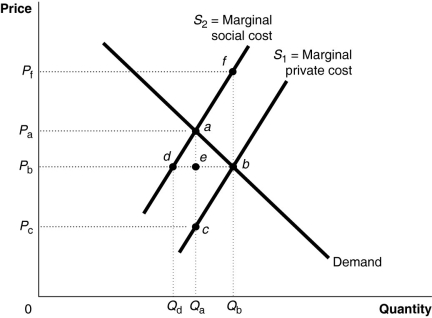
Figure 5-2 shows a market with a negative externality.
-Refer to Figure 5-2.The size of marginal external costs can be determined by
A) S₂ + S₁ at each output level.
B) S₂ - S₁ at each output level.
C) the supply curve S₂.
D) the supply curve S₁.
Correct Answer:
Verified
Q22: Which of the following conditions holds in
Q23: Figure 5-2 Q24: Figure 5-3 Q25: Figure 5-3 Q26: In the past the federal government often Q28: Which of the following describes how a Q29: Figure 5-2 Q30: A market demand curve reflects the Q31: Figure 5-2 Q32: Figure 5-3 Unlock this Answer For Free Now! View this answer and more for free by performing one of the following actions Scan the QR code to install the App and get 2 free unlocks Unlock quizzes for free by uploading documents
![]()
![]()
![]()
![]()
A)marginal private
![]()
![]()

