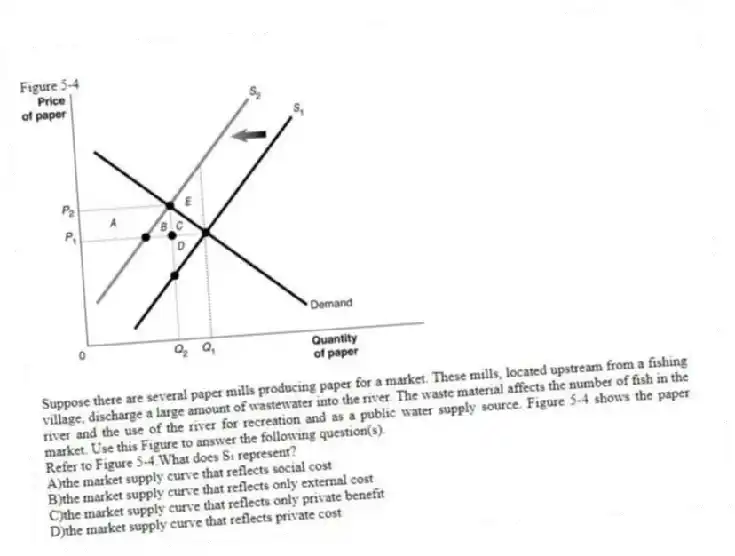
Figure 5-4
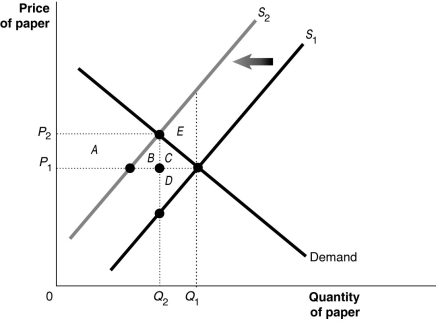
Suppose there are several paper mills producing paper for a market. These mills, located upstream from a fishing village, discharge a large amount of wastewater into the river. The waste material affects the number of fish in the river and the use of the river for recreation and as a public water supply source. Figure 5-4 shows the paper market. Use this Figure to answer the following question(s) .
-Refer to Figure 5-4.What does S₁ represent?
A) the market supply curve that reflects social cost
B) the market supply curve that reflects only external cost
C) the market supply curve that reflects only private benefit
D) the market supply curve that reflects private cost
Correct Answer:
Verified
Q51: Figure 5-4 Q52: When production generates a negative externality, the Q53: Which of the following could be evidence Q54: Assume that emissions from electric utilities contribute Q55: A free market fails when Q57: If there are no externalities, a competitive Q58: When there is a positive externality, Q59: The social cost of cutting trees for Q60: Which of the following describes how a Q61: Figure 5-6
![]()
A)there is government
A)the marginal
![]()
Unlock this Answer For Free Now!
View this answer and more for free by performing one of the following actions

Scan the QR code to install the App and get 2 free unlocks

Unlock quizzes for free by uploading documents