
Figure 5-5
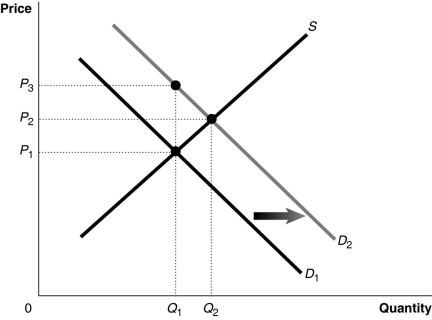
Figure 5-5 shows a market with an externality. The current market equilibrium output of Q₁ is not the economically efficient output. The economically efficient output is Q₂.
-Refer to Figure 5-5.If, because of an externality, the economically efficient output is Q₂ and not the current equilibrium output of Q₁, what does D₁ represent?
A) the demand curve reflecting external benefits
B) the demand curve reflecting social benefits
C) the demand curve reflecting private benefits
D) the demand curve reflecting the sum of private and social benefits
Correct Answer:
Verified
Q71: When there is a positive externality in
Q72: Figure 5-4 Q73: Figure 5-5 Q74: The marginal social cost of a good Q75: When there is a negative externality, the Q77: Figure 5-6 Q78: A market failure arises when an entire Unlock this Answer For Free Now! View this answer and more for free by performing one of the following actions Scan the QR code to install the App and get 2 free unlocks Unlock quizzes for free by uploading documents
![]()
![]()
![]()

