
Figure 5-6
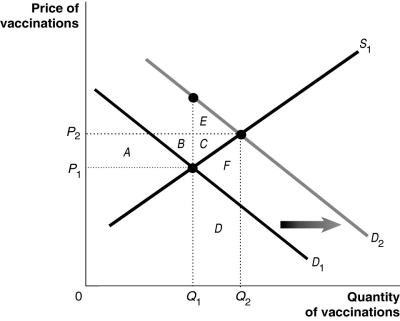
Figure 5-6 shows the market for measles vaccinations, a product whose use generates positive externalities.
-Refer to Figure 5-6.What does D₁ represent?
A) the demand curve reflecting social benefits
B) the positive externalities curve
C) the demand curve reflecting private benefits
D) the social welfare curve
Correct Answer:
Verified
Q56: Figure 5-4 Q57: If there are no externalities, a competitive Q58: When there is a positive externality, Q59: The social cost of cutting trees for Q60: Which of the following describes how a Q62: Figure 5-6 Q63: An externality is an example of a Q64: An externality refers to economic events outside Q65: Figure 5-6 Q66: Figure 5-6 Unlock this Answer For Free Now! View this answer and more for free by performing one of the following actions Scan the QR code to install the App and get 2 free unlocks Unlock quizzes for free by uploading documents
![]()
A)the marginal
![]()
![]()
![]()

