Multiple Choice

Figure 5-6
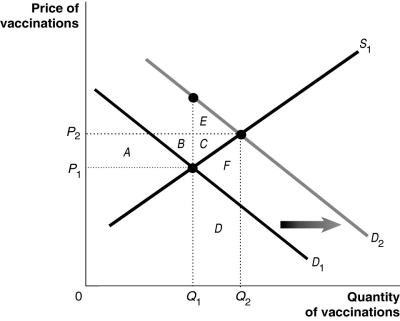
Figure 5-6 shows the market for measles vaccinations, a product whose use generates positive externalities.
-Refer to Figure 5-6.What does D₂ represent?
A) the social welfare curve
B) the demand curve reflecting marginal social benefits
C) the demand curve reflecting marginal private benefits
D) the positive externalities curve
Correct Answer:
Verified
Related Questions
Q72: Figure 5-4 Q73: Figure 5-5 Q74: The marginal social cost of a good Q75: When there is a negative externality, the Q76: Figure 5-5 Q78: A market failure arises when an entire Unlock this Answer For Free Now! View this answer and more for free by performing one of the following actions Scan the QR code to install the App and get 2 free unlocks Unlock quizzes for free by uploading documents
![]()
![]()
![]()

