
Figure 5-13
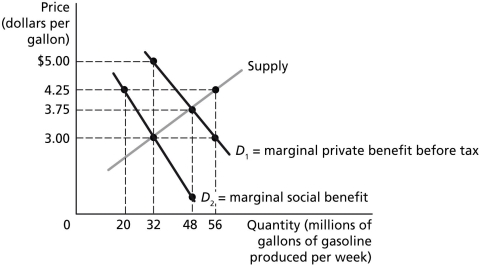
Figure 5-13 illustrates the market for gasoline before the government imposes a tax to bring about the efficient level of gasoline production.
-Refer to Figure 5-13.The market equilibrium quantity of gasoline is ________ million gallons per month.
A) 20
B) 32
C) 48
D) 56
Correct Answer:
Verified
Q163: Policies that mandate the installation of specific
Q164: Figure 5-12 Q165: The U.S.government has frequently used a "command-and-control" Q166: Figure 5-13 Q167: Figure 5-13 Q169: Figure 5-13 Q170: Figure 5-13 Q171: Which of the following is an example Q172: Figure 5-11 Q173: Assume that production from an electric utility Unlock this Answer For Free Now! View this answer and more for free by performing one of the following actions Scan the QR code to install the App and get 2 free unlocks Unlock quizzes for free by uploading documents
![]()
![]()
![]()
![]()
![]()
![]()

