
Figure 7-2
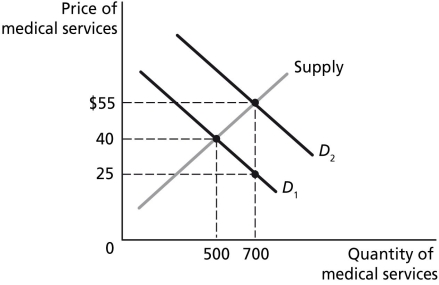
Figure 7-2 represents the market for medical services with and without insurance, and the effect of a third-party payer system on the demand for medical services.
-Refer to Figure 7-2.With insurance and a third-party payer system, the equilibrium quantity of medical services is
A) 200.
B) 500.
C) 700.
D) >700.
Correct Answer:
Verified
Q129: Figure 7-2 Q130: The Congressional Budget Office estimates that most Q131: In the United States, health care spending Q132: All of the following are part of Q133: Figure 7-2 Q135: Because consumers who have insurance provided by Q136: Higher deductibles for employer-provided health insurance will Q137: In addition to covering the costs of Q138: Figure 7-2 Q139: Figure 7-2 Unlock this Answer For Free Now! View this answer and more for free by performing one of the following actions Scan the QR code to install the App and get 2 free unlocks Unlock quizzes for free by uploading documents
![]()
![]()
![]()
![]()

