
Figure 11-7
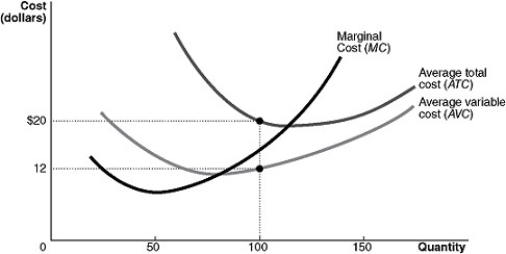
Figure 11-7 shows the cost structure for a firm.
-Refer to Figure 11-7.When the output level is 100 units, average fixed cost is
A) $12.
B) $8.
C) $4.
D) This cannot be determined from the diagram.
Correct Answer:
Verified
Q209: All of the following cost curves are
Q210: As output increases, the distance between average
Q211: Average total cost is equal to average
Q212: If production displays economies of scale, the
Q213: Which of the following is true at
Q215: Long-run cost curves are U-shaped because
A)of the
Q216: Economies of scale exist as a firm
Q217: If, when a firm doubles all its
Q218: As the level of output increases, what
Q219: Figure 11-7
![]()
Unlock this Answer For Free Now!
View this answer and more for free by performing one of the following actions

Scan the QR code to install the App and get 2 free unlocks

Unlock quizzes for free by uploading documents